Backtest: Retest — re-entry ladder evidence
19 drawdown episodes, 1998–2025 · SPX total return · 6 policies + 3 benchmarks · backtest run 2026-11-02; gate research 2026-11-03 · page generated 2026-11-03T17:01:42+00:00
Verdict — in-sample research finding
Regime-dependent. Robust single policy = L5b (stopped retest). L4 rejected (bear-rally trap). v7 exit legs must not be repurposed as re-entry triggers.
L5b is the only arm with positive secular-bear forward 12-month return (+7.9%), and it has the best secular mean and worst MAE. L3 is best in corrections, but the regime is not knowable in real time. This is a historical research result, not a portfolio rule or a current recommendation.
The four pre-registered questions
| Question | Answer |
|---|---|
| Q1: finer ladder (L2) beat coarse (L1)? | Tie — better entries, worse path damage. L1 kept for simplicity. |
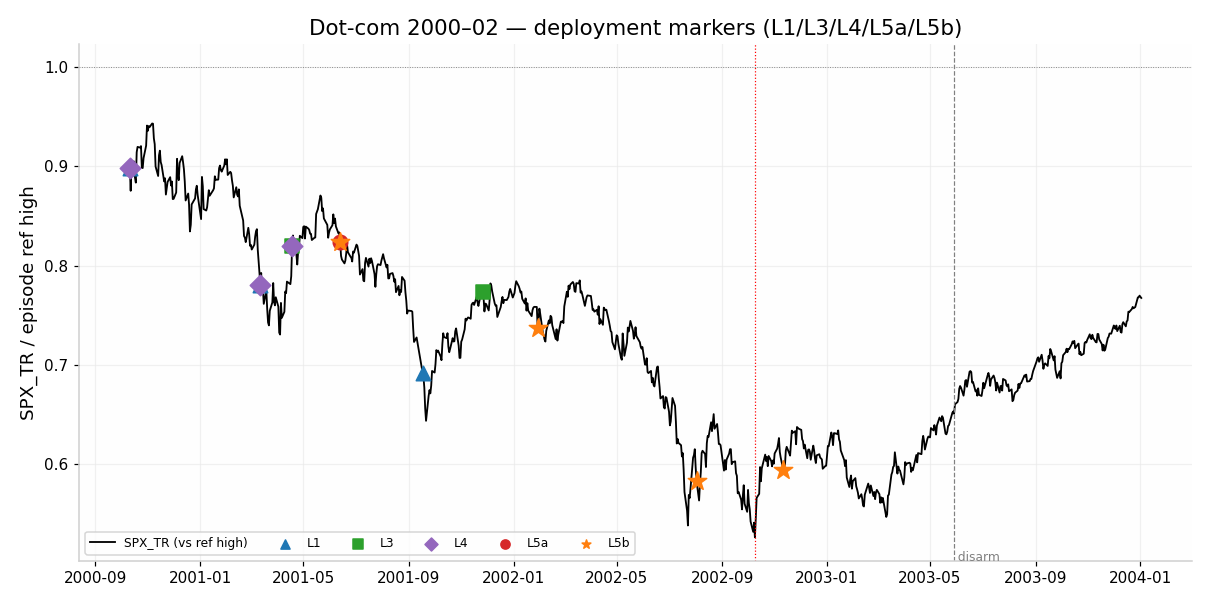
| Q2: does +10% acceleration (L4) dominate? | No — worst policy. Buys the first bear rally with ⅔ of capital (Apr-2001 → −37% more; May-2008 → −51% more). |
| Q3: do retest arms earn complexity vs L4? | L5b yes (wins both verdict axes); L5a no (holding through a broken low forfeits the stop's value). |
| Q4: is deployment timing paid at all? | Yes. Every policy beats buy-and-hold-through on both entry and path axes. B-v7 legs must not be reused as an entry signal. |
1. Master pooled table — all 19 episodes
| Arm | Rule (one line) | Entry disc vs high | fwd 6m | fwd 12m | MAE mean | MAE worst | Avg deployed | Alpha vs B-BH | Chained 1997→2026 (max DD) | Secular fwd 12m | Verdict |
|---|---|---|---|---|---|---|---|---|---|---|---|
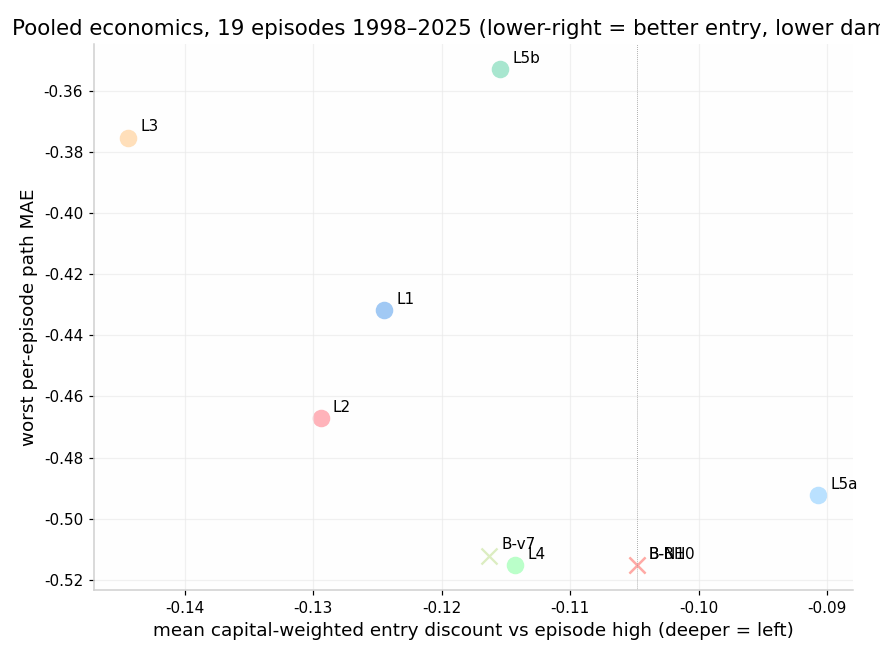
| L5b | buy 5% retest of +10% rebound; stop at old low; re-arm | −11.5% | +10.6% | +14.2% | −10.4% | −35.3% | 16% | +3.0% | 1.89x (−35.3%) | +7.9% | robust winner |
| L3 | 50% at +10% off low, 50% at +20% | −14.4% | +11.0% | +19.0% | −5.3% | −37.5% | 17% | +2.7% | 1.81x (−39.7%) | −10.4% | best in corrections |
| L1 | ⅓ at −10/−20/−30% | −12.4% | +8.6% | +11.0% | −6.8% | −43.2% | 42% | +2.5% | 1.72x (−44.4%) | −15.4% | simple baseline |
| L2 | ¼ at −10/−15/−20/−25% | −12.9% | +9.9% | +12.0% | −7.6% | −46.7% | 43% | +2.5% | 1.72x (−51.3%) | −16.2% | tie with L1 — finer grid unpaid |
| L5a | L5b entry, hold through everything | −9.1% | +7.7% | +9.8% | −9.3% | −49.2% | 20% | +2.5% | 1.67x (−51.5%) | −22.0% | no earned complexity |
| L4 | L1 + deploy-all on first +10% rebound | −11.4% | +8.7% | +10.5% | −8.8% | −51.5% | 50% | +1.4% | 1.37x (−56.3%) | −22.6% | rejected — bear-rally trap |
| B-v7 | buy when v7 exit condition ×3 | −11.6% | −2.2% | +4.9% | −6.5% | −51.2% | 17% | +0.4% | 1.13x (−57.3%) | −25.8% | worst arm — not a re-entry trigger |
| B-BH | 100% invested from −10% | −10.5% | +7.2% | +7.9% | −11.8% | −51.5% | 100% | — | 1.03x (−59.3%) | −26.6% | naive benchmark |
| B-N10 | identical to B-BH by construction | — | — | — | — | — | — | — | — | — | — |
Column definitions and reading guide
Entry disc vs high = how far below the pre-drawdown high the average dollar bought. fwd 6m/12m = return on deployed capital after entry. MAE = worst portfolio drawdown after first deployment (mean across episodes / single worst). Avg deployed = capital at risk, with the remainder in 2Y cash. Alpha vs B-BH = per-episode return minus buy-and-hold-through. Chained = compounding all episodes with cash between, an insurance-stance readout; always-invested SPX was 13.83x / −55.3%. Secular fwd 12m covers dot-com and GFC only.
B-N10 is identical to B-BH by construction because episode arming is the first −10% close. The chained comparison is not an always-invested portfolio replacement: every arm spends roughly 85% of days in cash.
2. Regime split
| Arm | Corrections (17 eps): fwd 12m / MAE mean | Secular bears (dot-com, GFC): fwd 12m / MAE mean |
|---|---|---|
| L3 | +27.4% / −1.7% ← best | −10.4% / −35.7% |
| L5b | +15.2% / −7.9% | +7.9% / −32.2% ← best (only positive) |
| L1 | +14.1% / −3.1% | −15.4% / −38.3% |
| L4 | +14.4% / −4.4% | −22.6% / −45.6% |
| B-BH | +12.0% / −7.5% | −26.6% / −47.9% |
Corrections reward buying the confirmed rebound (L3); secular bears reward defined-risk retests with a stop (L5b). With the regime unknowable in real time, L5b is the single research policy that survives both samples.
3. Episode charts
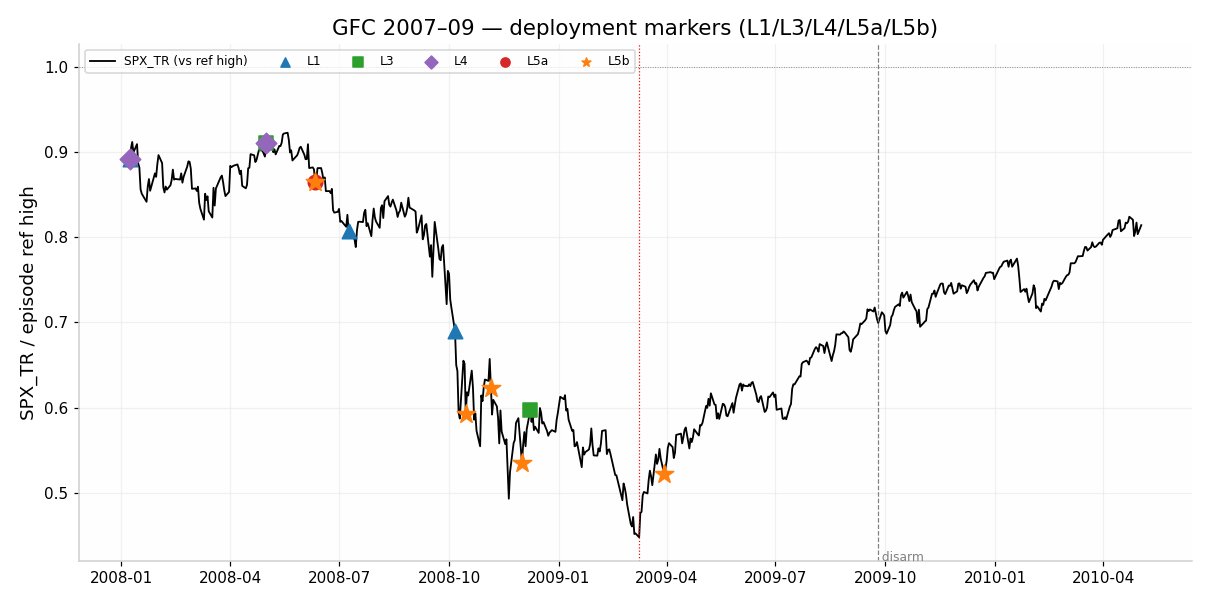
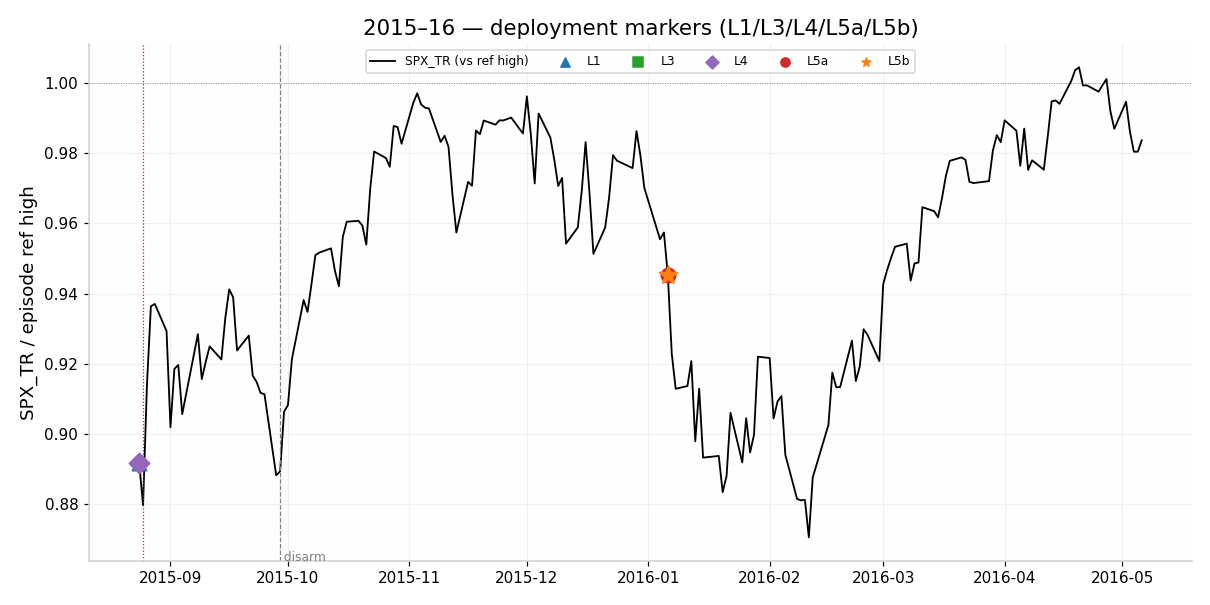
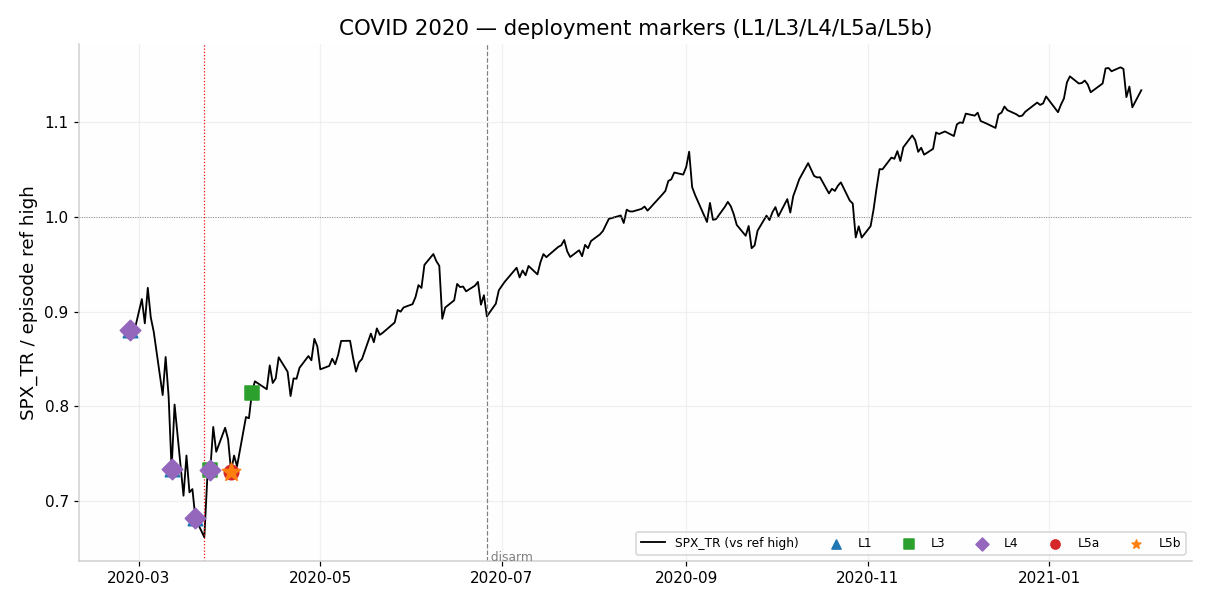
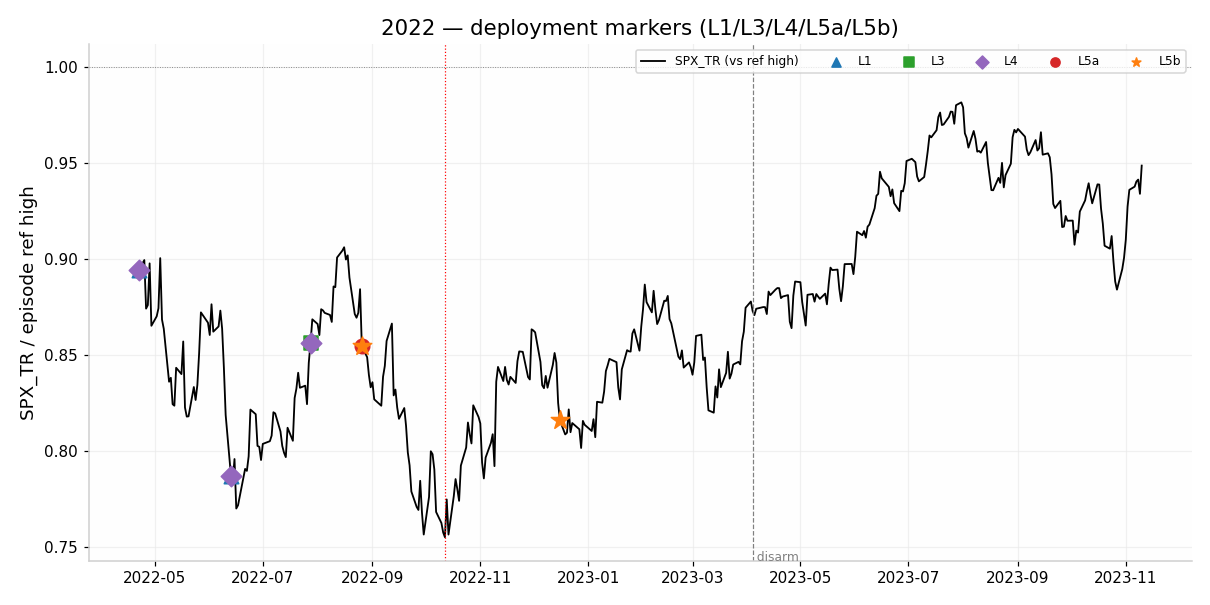
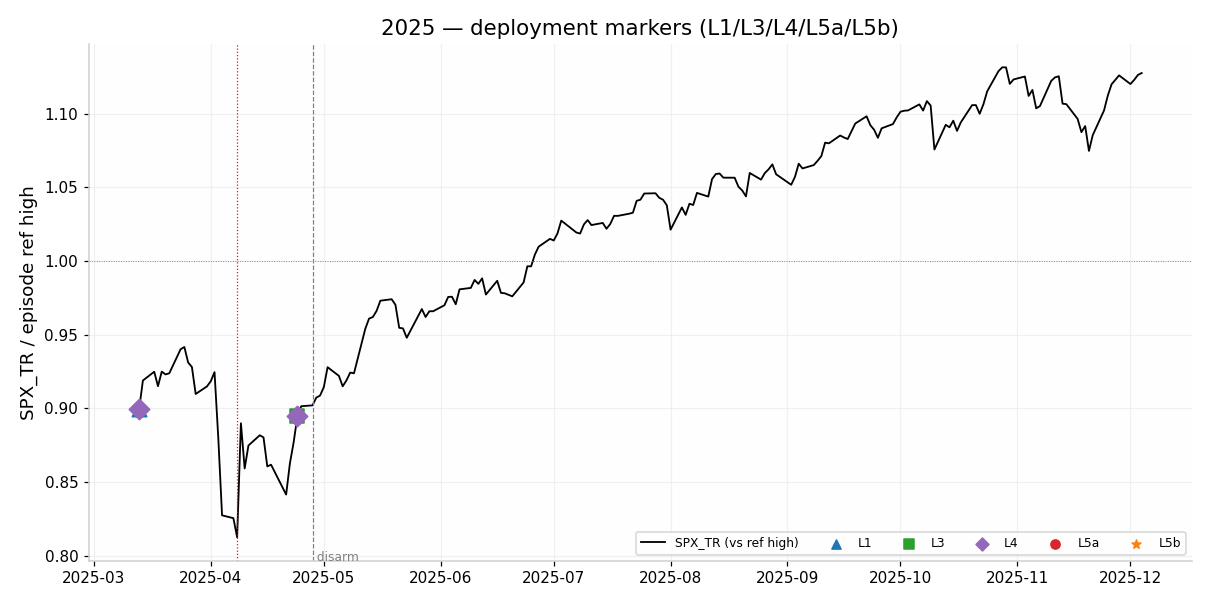
SPX total return relative to each episode reference high, with historical deployment markers. The dashed line marks disarm where shown.
Pooled economics across 19 episodes
Dot-com bear market, 2000–02
Global financial crisis, 2007–09
2015–16 correction
COVID bear market, 2020
2022 bear market
2025 V-bottom
4. Autopsy — L5b triggers, stops, and named episodes
1. The full cycle table — before / during / after each retest
Phases: Rebound = running low → +10% rebound high · Pullback = rebound high → retest trigger · After = 63 sessions post-trigger.
| Trigger | Outcome | 10Y rebound (bp) | 10Y pullback (bp) | 10Y after +63 (bp) | HB/LV rebound % | HB/LV pullback % | HB/LV s20 % | HB/LV vs SMA50 % | Post-entry MAE | fwd 6m | Ep max DD |
|---|---|---|---|---|---|---|---|---|---|---|---|
| 1998-10-01 | held | −31 | −37 | +35 | +7.4 | −6.8 | −4.9 | −9.1 | −2.7 | +34.8 | −19.2 |
| 2000-01-28 | held | +38 | +22 [rate-shock veto] | −45 | +36.1 | −3.8 | −3.4 | +1.3 [OFFLEAD] | −1.9 | +5.0 | −11.8 |
| 2000-07-28 | stopped | −29 | −11 | −34 | +23.4 | −10.8 | −1.0 | −2.5 | −3.7 | −3.4 | −9.9 |
| 2001-06-13 | stopped | +46 | −11 | −56 | +38.8 | −13.1 | −3.3 | −4.1 | −12.3 | −8.0 | −47.4 |
| 2002-01-29 | stopped | +44 | −19 | +14 | +42.2 | −10.0 | −2.9 | −4.6 | −13.3 | −17.4 | −47.4 |
| 2002-08-02 | stopped | +5 | −17 | −40 | −10.3 | −4.8 | −13.3 | −16.0 | −8.8 | +0.5 | −47.4 |
| 2002-11-11 | held | +47 | −19 | +7 | +39.7 | −9.6 | +18.3 [OFFLEAD] | +9.6 [OFFLEAD] | 0.0 | +8.3 | −47.4 |
| 2008-06-11 | stopped | +37 | +24 [rate-shock veto] | −44 | +8.6 | −12.3 | −11.9 | −9.8 | −5.4 | −32.6 | −55.3 |
| 2008-10-15 | stopped | +11 | −3 | −174 | −0.4 | +0.4 | −9.7 | −15.2 | −1.2 | −2.7 | −55.3 |
| 2008-11-05 | stopped | +4 | −2 | −71 | +15.1 | −5.5 | −4.8 | −14.0 | −15.2 | −1.0 | −55.3 |
| 2008-12-01 | stopped | −9 | −19 | +24 | +24.3 | −11.1 | −24.6 | −23.0 | −8.2 | +15.8 | −55.3 |
| 2009-03-30 | held | −12 | −3 | +77 | +28.1 | −10.7 | +13.2 [OFFLEAD] | +0.5 [OFFLEAD] | 0.0 | +36.5 | −55.3 |
| 2010-08-23 | held | −15 | −23 | +27 | +6.1 | −7.0 | −7.3 | −5.2 | −1.9 | +24.5 | −15.6 |
| 2011-11-01 | held | +56 | −33 | −17 | +22.9 | −5.5 | +11.7 [OFFLEAD] | +2.1 [OFFLEAD] | −4.7 | +15.5 | −18.6 |
| 2016-01-06 | stopped | +14 | −4 | −48 | +4.7 | −11.5 | −4.8 | −6.9 | −7.9 | +6.6 | −12.0 |
| 2016-06-27 | held | +4 | −26 | +15 | +19.9 | −12.3 | −11.3 | −9.9 | 0.0 | +14.4 | −13.0 |
| 2018-10-11 | stopped | +33 | +9 [rate-shock veto] | −45 | +2.2 | −5.3 | −2.5 | −4.0 | −7.7 | +7.6 | −9.8 |
| 2019-05-29 | held | −21 | −26 | −79 | +11.6 | −8.6 | −8.4 | −6.4 | −1.4 | +13.7 | −19.4 |
| 2020-04-01 | held | +6 | −26 | +9 | +2.8 | −5.9 | −11.9 | −12.1 | 0.0 | +37.4 | −33.8 |
| 2022-04-12 | stopped | +55 | +33 [rate-shock veto] | +24 | +7.1 | −10.5 | −3.9 | −8.2 | −6.0 | −18.0 | −12.8 |
| 2022-08-26 | stopped | −39 | +24 [rate-shock veto] [OFFLEAD] | +64 | +10.8 | −4.3 | −2.0 | +1.0 [OFFLEAD] | −10.0 | −1.3 | −24.5 |
| 2022-12-16 | held | −29 | −12 | +13 | +4.3 | −4.4 | −5.3 | −1.9 | −1.8 | +14.3 | −24.5 |
| 2024-04-19 | held | −63 | +42 [rate-shock veto] | −37 | +20.8 | −5.8 | −5.8 | −4.3 | 0.0 | +18.9 | −9.9 |
[rate-shock veto] = 10Y rose during pullback · [OFFLEAD] = offensives leading at trigger (s20>0 or HB/LV > 50d SMA)
L5b round-trips — 12 stopped cycles
| Episode | Entry | Exit | Realized |
|---|---|---|---|
| correction_2000_b | 2000-07-28 | 2000-10-11 | −3.7% |
| dotcom_2000_02 | 2001-06-13 | 2001-09-07 | −12.3% |
| dotcom_2000_02 | 2002-01-29 | 2002-07-02 | −13.3% |
| dotcom_2000_02 | 2002-08-02 | 2002-10-07 | −8.8% |
| gfc_2007_09 | 2008-06-11 | 2008-07-02 | −5.4% |
| gfc_2007_09 | 2008-10-15 | 2008-10-22 | −1.2% |
| gfc_2007_09 | 2008-11-05 | 2008-11-19 | −15.2% |
| gfc_2007_09 | 2008-12-01 | 2009-02-23 | −8.2% |
| correction_2015 | 2016-01-06 | 2016-02-11 | −7.9% |
| correction_2018_b | 2018-10-11 | 2018-12-19 | −7.7% |
| correction_2022 | 2022-04-12 | 2022-04-29 | −6.0% |
| bear_2022 | 2022-08-26 | 2022-09-27 | −10.0% |
Realized losses range from −1.2% to −15.2%, mean −8.3%. The stop converts the census's average −17.2% failed-cycle excursion into bounded realized losses and leaves L5b 0% deployed at both secular ultimate lows. Gap-throughs remain possible: the 2008-11-05 cycle realized −15.2% despite a nominal −5% stop level.
Named episodes
| Episode | What happened |
|---|---|
| COVID 2020 | L5's Apr-1 retest = best entry of any arm: +22.4% episode return, −7.1% MAE (vs B-BH −28.4% MAE). |
| 2025 V-bottom | L5 cost visible: window expired Oct-23 with max pullback −2.96%; never deployed. L1 held only ⅓. L3/L4 got 50–100% in by Apr-24. |
| Dot-com | L5b: stopped 3× (−12.3/−13.3/−8.8%), re-entered Nov-2002 at −40.6% below high and rode the recovery. L4 accelerated Apr-2001 and ate −20.4%. |
| GFC | L5b: stopped 4×, flat at the exact bottom, re-entered Mar-30-2009 (4 sessions post-low) → episode −0.8% vs B-BH −21.7%. |
5. Gate research — descriptive, in-sample hypotheses
2. The anatomy of a healthy vs failed retest cycle
| Phase | Healthy (→ held, n=11) | Failed (→ stopped, n=12) |
|---|---|---|
| Rebound: 10Y | −1.8bp avg (yields can fall — growth-scare bottom) | +14.3bp avg (yields rise into rebound — bear rally against tightening) |
| Rebound: HB/LV | +18.2% (offensives lead the recovery) | +13.9% (same — rebound leadership does NOT discriminate) |
| Pullback: 10Y | −12.8bp avg (flight-to-safety bid returns) | +0.3bp avg (no safe-haven bid — the bond market IS the problem) |
| Pullback: HB/LV | −7.3% (defensives lead the dip) | −8.2% (same — pullback defensiveness is universal, 22/23) |
| After +63: 10Y | 0.0bp (stable) | −32bp (yields collapse — growth scare confirmed ex-post) |
| After +63: HB/LV | +13.6% (offensives resume leadership) | −11.8% (defensives keep leading) |
| Post-entry MAE | −1.3% | −8.3% |
| fwd 6m / 12m | +20.3% / +24.4% | −4.5% / +4.3% |
The normal retest is a growth scare: yields fall during the pullback, defensives lead, then offensives resume after a successful hold. The failure signature is when the pullback is rate-driven — yields rising into the retest means the drawdown's cause (tightening/inflation) is still active. Rebound-phase and pullback-phase HB/LV direction are nearly identical in both groups — only the persistence of offensive leadership into the trigger day ( [OFFLEAD]) carries signal.
3. Gate 1 — rate-shock veto (skip if 10Y rose during pullback)
| Trades | Held | Post-entry MAE | fwd 6m | fwd 12m | |
|---|---|---|---|---|---|
| Vetoed (10Y rose) | 6 | 2 | −5.2% | −3.4% | +0.5% |
| Kept (10Y fell/flat) | 17 | 9 | −4.9% | +11.2% | +18.7% |
- Vetoes 2008-06 (+24bp → −32.6% fwd 6m), 2022-04 (+33bp → −18.0%), 2018-10, 2022-08 — all genuine rate-shock regimes. Strongest single linear relation in the study: pullback Δ10Y vs fwd 6m, r = −0.45.
- Honest cost: vetoes 2 winners — 2000-01 (+22bp, +1.4% fwd 12m, mediocre) and 2024-04 (+42bp, +18.9% fwd 6m, zero drawdown — a clean winner). The gate fails when a rate shock is small, self-limiting, and growth stays intact. No in-sample separator found (rate level / CPI regime is a hypothesis, not a tested rule).
- The gate improves forward returns, not per-trade path risk (MAE −4.9% vs −5.2% — no separation).
- Threshold robustness: >0 / >+10 / >+20bp all veto 5–6 trades with identical direction; fwd 6m kept ≈ +11% vs vetoed −3.4% to −5.6%.
4. Gate 2 — OFFLEAD sizing tilt (offensives still leading at trigger)
| Trades | Held | Post-entry MAE | fwd 6m | |
|---|---|---|---|---|
| OFFLEAD on | 5 | 4 | −3.3% | +12.8% |
| OFFLEAD off | 18 | 7 | −5.4% | +5.9% |
| Stacked: rate-gate-kept AND OFFLEAD on | 3 | 3 | −1.6% | +20.1% (fwd 12m +30.8%) |
- The 3 stacked signals are the three generational retests: 2002-11-11, 2009-03-30, 2011-11-01 — fwd 12m +21.6 / +52.2 / +18.7%, two with zero post-entry drawdown. Offensive leadership persisting through a retest marks the true cycle turn.
- Conflict cases (both flags): 2000-01 (held, mediocre) and 2022-08 (stopped) — when the two disagree, the rate gate was right both times; OFFLEAD must never override the veto. Tilt, don't veto: 100% size when on, reduced when off.
5. Relationship to trough depth
- Stopped triggers sit in far deeper episodes (mean ep DD −36.0% vs −24.4% for held). All 8 triggers that fired before their episode's ultimate trough were stopped mechanically — the anchor is, by construction, above the final low.
- Of those 8 doomed pre-trough trades, the rate gate flags only 2 (2008-06, 2022-08). The other 6 were growth-scare failures with falling yields (dot-com −11/−19/−17bp, GFC Oct–Dec −3/−2/−19bp) — invisible to both gates ex-ante. The stop-loss remains the primary defense; gates are a return-enhancer, not a crash-shield.
- Deep episodes (>25% DD): 10 triggers, 3 held, only 1 rate-vetoed — deep bears are growth-driven, yields fall in pullbacks. Shallow episodes (<15%): 7 triggers, 3 held, 4 rate-vetoed — shallow drawdowns in hiking/inflation scares are exactly where the rate gate concentrates.
- HB/LV pullback behavior has no relation to trough depth (r ≈ +0.07); rate-rise-during-pullback correlates mildly with shallower ultimate depth (r = +0.13) — rate shocks produce sharp but shorter drawdowns.
7. Magnitude dose-response & sizing simulation (2026-11-03, owner question)
7.1 Does magnitude matter? Yes — at the extremes, and non-linearly
10Y pullback move buckets:
| 10Y during pullback | n | Held | fwd 6m | fwd 12m | Post-entry MAE |
|---|---|---|---|---|---|
| fell >20bp (panic-grade safe-haven bid) | 6 | 6/6 (p=0.012) | +23.4% | +26.3% | −1.8% |
| fell 0–20bp | 11 | 3/11 (27% — worst bucket) | +4.5% | +14.5% | −6.6% |
| rose | 6 | 2/6 | −3.4% | +0.5% | −5.2% |
Dates in the 6/6 bucket: 1998-10, 2010-08, 2011-11, 2016-06, 2019-05, 2020-04. The middle bucket is polluted by slow-bleed secular mid-retests (2001, 2002×2, 2008×3, 2016-01) — a modest yield fall is the signature of grinding bears, not capitulation. Within rate-kept trades, corr(Δ10Y, fwd 6m) = −0.42 (bigger fall → better). Do not size linearly in Δ10Y.
Offensive-lead magnitude: strong (s20 > +10pp) = 3/3 held (2002-11, 2009-03, 2011-11; fwd 6m +20.1%, MAE −1.6%); marginal flag (HB/LV>SMA50 only, s20<0) = 1/2 — and both marginals are the rate-gate conflicts anyway.
The union — "strong" = 10Y fell >20bp OR s20 > +10pp: 8/8 held (adds 2002-11, 2009-03 to the six above), fwd 6m +23.1%, fwd 12m +29.0%, worst MAE −4.7%. Complement: 3/12 held, fwd 6m −1.0%. Binomial p ≈ 0.0027 — the first split in this research program to touch the Bonferroni bar (~0.005). Caveat: the union is itself a post-hoc composite, so effective multiplicity is worse than the raw bar.
7.2 Owner's proposed sizing rule, simulated through the canonical engine
Rule as proposed: at each L5b trigger — 0% if 10Y rose during pullback; 35% if 10Y fell; +35% (→70%) if offensives also lead (s20>0 or HB/LV>50d SMA); residual stays in 2Y cash. Also tested a magnitude-tiered form (70% tier = "strong" union above) and a 0/50/100 scaling.
| Variant (19 episodes) | Ep ret | fwd 6m* | fwd 12m* | MAE mean | MAE worst | Avg deployed | Foregone vs BH | Chained** |
|---|---|---|---|---|---|---|---|---|
| L5b pure (100%) | +0.6% | +10.6% | +14.2% | −10.4% | −34.9% | 15.7% | +3.1% | 1.80x |
| V-user 0/35/70 | +2.0% | +15.7% | +20.7% | −3.4% | −13.9% | 7.2% | +4.4% | 2.40x |
| V-mag 0/35/70 (70% = strong union) | +2.6% | +15.7% | +20.7% | −4.4% | −13.9% | 9.4% | +5.0% | 2.67x |
| V-mag 0/50/100 | +3.1% | +15.6% | +20.5% | −6.0% | −20.9% | 13.1% | +5.5% | 2.87x |
*fwd per deployed dollar is identical across sized variants by construction (relative weights coincide within multi-buy episodes; single-buy weights cancel). **Chained here = episodes compounded with 2Y cash between; pure L5b reads 1.80x vs the report's 1.89x (minor chain-method detail, identical across variants — comparisons valid).
7.3 Where the user's scheme wins and pays (per-episode ep_ret vs pure L5b)
- Gains, all in secular/extended bears: dot-com +21.4pp (−20.0% → +1.3%), GFC +18.2pp (−0.7% → +17.4%), 2022 +7.3pp. Mechanism: stopped-trade capital damage falls from 0.997 to 0.247 units of episode capital across the 12 stops.
- Costs, all in V-bottom corrections: 2020 −14.5pp (+22.4% → +7.9% — only 35% deployed at the best single entry of the whole study), 1998 −5.1pp, 2010 −1.5pp. The 2020 cost is precisely what the magnitude tier fixes: 10Y fell −26bp there → "strong" → 70% under V-mag.
- The scheme is a secular-bear insurance overlay, paid for with correction upside — the same regime trade-off as every construct in this program. It is not a free lunch.
7.4 Strategist assessment
The 0/35/70 structure is sound and pre-registrable: veto first (rate), tilt second (leadership), never inverted (both conflict cases resolved in the rate gate's favor). Recommended frozen form — L6c: 0% if Δ10Y(pullback) > 0; 35% base if ≤ 0; 70% if "strong" (Δ10Y ≤ −20bp OR s20 > +10pp) — which dominates the literal rule in-sample on every axis and is defensible a priori from the dose-response evidence. Known retained costs: 2024-04-19 gets 0% (clean winner skipped); the 35% floor still bleeds in the fell-0–20bp bucket (8 of 12 historical stops). Statistical status unchanged: gates selected on the same 23 events, secular gain driven by 2 episodes, union split post-hoc — freeze now, validate out-of-sample, no further tier-shopping on this dataset. Analytical only; any allocation role requires explicit owner approval.
8. Drawdown depth at trigger — amplifier, not signal (2026-11-03)
8.1 Depth alone does NOT discriminate hit/miss
| Depth measure at trigger | Held (11) | Stopped (12) | corr vs fwd 6m |
|---|---|---|---|
| Depth below pre-drawdown high | −15.8% | −21.9% | r = −0.09 |
| Cushion above anchor stop | +11.6% | +8.1% | r = +0.20 (weak, mechanical — closer to stop = easier to breach) |
| Pullback depth from rebound high | −5.8% | −6.3% | r = −0.03 (no info — −5% by construction) |
Deep triggers (<−15% below high): 5/11 held. Shallow: 6/12 held. No discrimination.
8.2 But depth AMPLIFIES signal quality — the 2×2
| union-strong (10Y fell>20bp OR s20>+10) | no signal | |
|---|---|---|
| Deep (<−15%) | 4/4 held, fwd 6m +29.2%, fwd 12m +42.8%, worst MAE −2.7% — 1998-10, 2002-11, 2009-03, 2020-04 (the four generational entries) | 1/7 held, fwd 6m +0.2%, worst MAE −15.2% — falling knives (2001, 2002×2, 2008×3, only 2022-12 held) |
| Shallow | 4/4 held, fwd 6m +17.0% | 2/8 held, fwd 6m −2.1% |
Reading: hit/miss is determined by the signal (8/8 vs 3/15); depth scales the payoff (+29.2% vs +17.0% within confirmed trades — deeper entry = bigger discount) and the penalty (deep without signal = serial stop-outs at depth; worst MAE −15.2%). Depth is a leverage knob on signal quality, not a gate.
8.3 Naive 3-factor count (rate-kept + union + deep) — robustness check
Score 3: 4/4 held, +29.2% · score 2: 5/11, +6.3% · score 1: 0/2 · score 0: 2/6, −3.4%. Monotone gradient, but no better than the union alone — "deep + merely-modest yield fall" (score-2 secular retests) is exactly the slow-bleed trap. Keep L6c frozen as defined; do not add a depth tier on the same 23 events.
8.4 "Secular-bear insurance, paid with correction upside" — the formal statement
L5b's anchor stop already converts every failed retest into a bounded ~−8% realized loss. Therefore:
- In corrections (17/19 episodes) the retest usually holds and the market V-recovers; the only risk is under-deployment. Any sizing gate's cost here = foregone upside on the undeployed fraction — bounded, partial, and incurred in a rising market (2020: −14.5pp ep-ret from 35% vs 100% at the best entry; 1998 −5.1pp; 2010 −1.5pp).
- In secular/extended bears the retest fails repeatedly (8 of 12 stops cluster in dot-com/GFC/2022); serial full-size entries bleed ~−8% each. The gates' vetoes/underweights concentrate exactly there (+21.4pp dot-com, +18.2pp GFC, +7.3pp 2022; stopped-trade capital damage 1.00 → 0.25 units; chained 1.80x → 2.40x).
- Asymmetry: the premium (correction upside foregone) is bounded per episode (you still hold 35–70% of a recovering market), while the payout (secular serial-bleed avoided) is unbounded in repetition. Since regime is unknowable in real time (RSM 0/4320, rotation 0/21), the sized policy deliberately overpays in the frequent benign case to cap the rare ruinous one — structurally identical to buying drawdown insurance.
Mandatory caveats — read before interpreting any result
- n=23 events. The gate research covers only 23 L5b triggers; the broader ladder study covers 19 episodes, including just two secular bears.
- Selection bias: the gates were selected on the same data used to evaluate them. All gate and sizing results are in-sample and hypothesis-grade.
- Multiple testing: nothing passes the Bonferroni bar except the post-hoc union (p≈0.0027), which is itself post-hoc; its effective multiplicity is worse than the raw threshold.
- Documented data deviation: the B-v7 arm used Bloomberg HY OAS, not the pinned FRED series. It therefore cannot fire before approximately October 2000 and is undeployed in four of 19 episodes. The six policy arms are unaffected.
- L6c is a FROZEN PRE-REGISTERED HYPOTHESIS awaiting out-of-sample validation. It is not a validated signal and must not be tier-shopped further on this dataset.
- NO ALLOCATION ROLE — ANALYTICAL ONLY. Nothing on this page changes the frozen v7 framework, portfolio weights, deployment instructions, or any existing monitor. Any future allocation role requires separate explicit owner approval.