Backtest v7 — corrected forward-drawdown evidence
Evaluation frame 2000-08-15 → 2026-04-07 ·
evidence base v7_backtest_results.md (pre-computed, rendered
verbatim) · page generated 2026-10-01T15:09:07+00:00 · live
implementation: monitor v7 (frozen 2026-10-01)
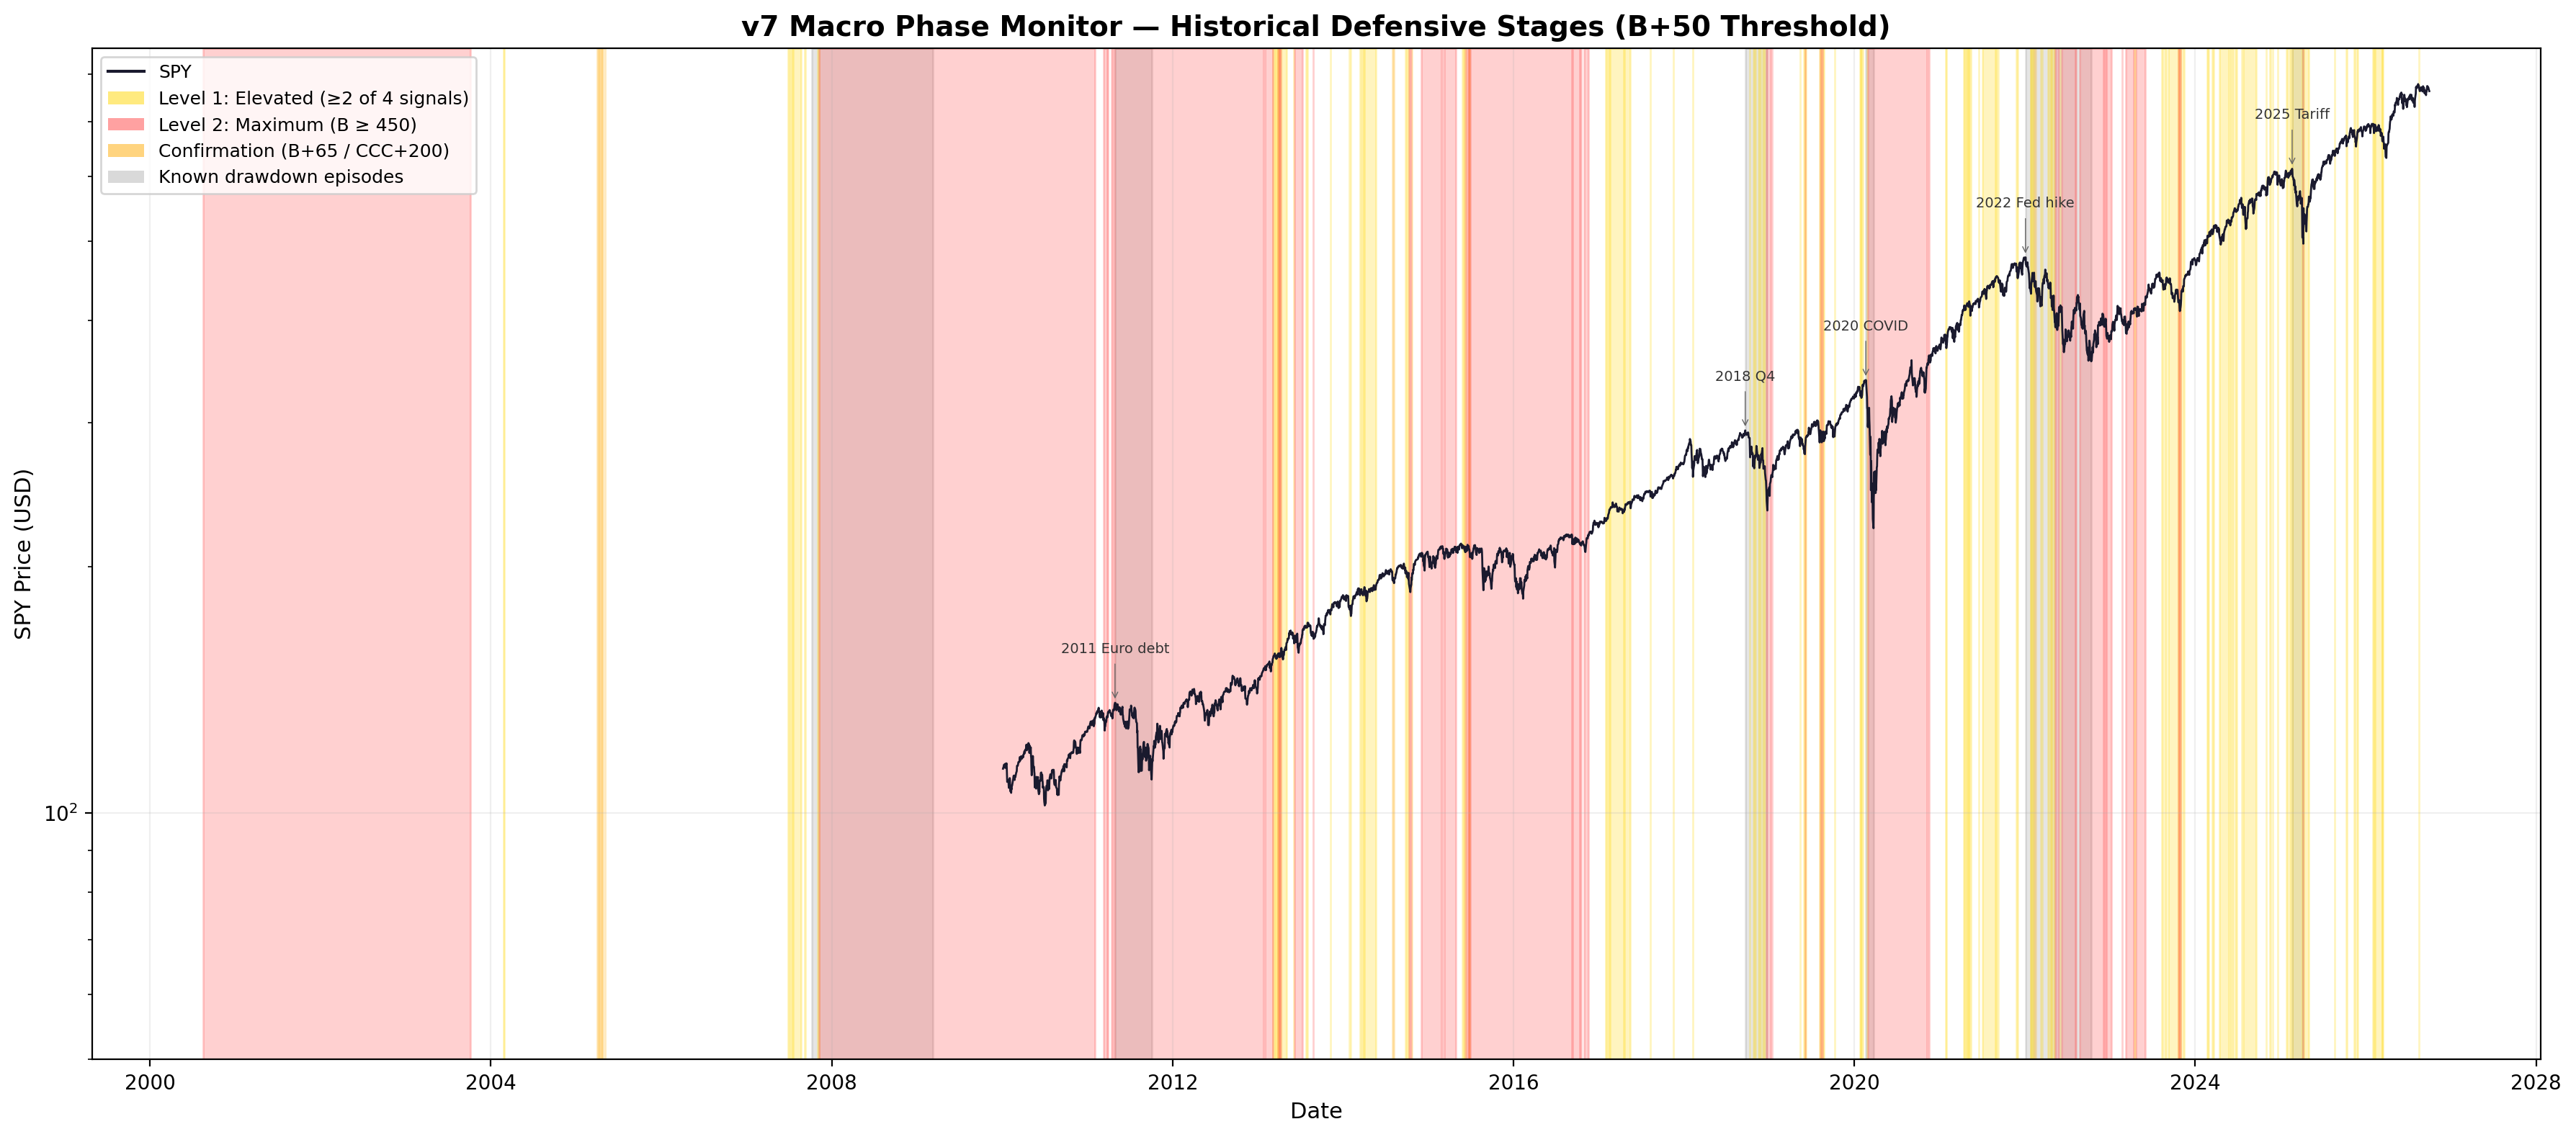
SPY (log scale) with the v7 defensive stages replayed on
history: yellow = Level 1 (Elevated, ≥2 of 4 signals),
red = Level 2 (Maximum, B ≥ 450), orange =
Confirmation (B+65 / CCC+200), grey bands = known drawdown
episodes. Chart generated once by backtest_v7_chart.py and embedded
unchanged.
The v7 live framework (deployed on the monitor, frozen 2026-10-01)
- Defensive Level 1 — ELEVATED. ≥2 of 4 signals fire simultaneously (raw fire, not latched): (1) B OAS widens ≥50 bps / 20 sessions; (2) SPHB/SPLV < 50-day SMA; (3) T10Y2Y ≥ 12-month min + 0.25; (4) VIX > 1.5 × 20-day SMA. Expected: ~3 triggers/yr | 6m drawdown rate ~35–37%.
- Defensive Level 2 — MAXIMUM. B OAS level ≥ 450 bps (sustained). Expected: ~1.6 triggers/yr | 6m drawdown rate ~35%.
- Confirmation (2A/2B escalation only). Existing B+65 velocity and CCC+200 legs (15-session latches) and the in-drawdown window logic — certifies damage is underway; used for 2A/2B timing, NOT for the initial defensive trigger.
- Removed vs v1–v6: G3 (DGS10 ≥ 5.10% or z ≥ +3.0) — 6m drawdown rate 22.7%, worse than the 13.8% random base rate; it fires during crises, not before them. The “pre-peak window” metric is replaced by forward drawdown from the signal day.
- Owner decision 2026-10-01: Level-1 leg 1 deploys at B+50. The head-to-head below recommended B+40 on sensitivity grounds; B+50 was selected for the live trigger (and is what the chart uses): 3.0 fires/yr at a 33.8% 6m drawdown rate vs 3.3 fires/yr at 30.5% for B+40.
Base rates (random expectation)
| Horizon | P(≥10% drawdown) | Mean Return | Median Return |
|---|---|---|---|
| 3 months | 7.8% | 3.1% | 3.9% |
| 6 months | 13.8% | 6.3% | 7.0% |
Any signal must beat the 6-month base rate of 13.8% to earn a defensive role.
Table 1: all signals ranked by forward 6M drawdown rate
Fire-run level: each contiguous raw-fire event = one test. Looks forward from fire start.
| Rank | Signal | Fires | DD 3m | DD 6m | Mean 3m | Med 3m | Mean 6m | Med 6m | P10 3m | P10 6m | Type |
|---|---|---|---|---|---|---|---|---|---|---|---|
| 1 | Baa-G1 +65 OR ≥425 | 1 | 100.0% | 100.0% | 17.9% | 17.9% | 24.9% | 24.9% | 17.9% | 24.9% | reference |
| 2 | B ≥ 450 | 40 | 17.5% | 35.0% | 3.9% | 3.1% | 6.9% | 9.4% | -5.4% | -6.4% | credit_lvl |
| 3 | B +50 | 74 | 20.3% | 33.8% | 3.8% | 4.8% | 6.7% | 6.3% | -5.7% | -7.9% | credit_vel |
| 4 | T10Y2Y ≥ 12m min+0.25 | 58 | 20.7% | 32.8% | 1.8% | 2.8% | 5.1% | 5.6% | -7.0% | -5.1% | tier2 |
| 5 | ICSA 4wk ≥ 1y min+25k | 29 | 3.4% | 31.0% | 4.3% | 4.3% | 7.5% | 9.8% | -5.0% | -11.2% | tier2 |
| 6 | B +40 | 82 | 19.5% | 30.5% | 3.9% | 4.2% | 7.0% | 6.4% | -4.8% | -6.7% | credit_vel |
| 7 | CCC +150 | 23 | 26.1% | 30.4% | 6.9% | 6.5% | 12.0% | 12.6% | 1.3% | 1.2% | credit_vel |
| 8 | B +60 | 67 | 25.4% | 29.9% | 3.8% | 4.9% | 7.7% | 8.4% | -5.0% | -4.5% | credit_vel |
| 9 | VIX > 20 | 130 | 20.0% | 29.2% | 3.5% | 4.9% | 5.1% | 6.4% | -6.1% | -8.1% | macro |
| 10 | B +65 | 62 | 25.8% | 27.4% | 4.5% | 5.0% | 9.0% | 9.7% | -6.0% | -3.0% | credit_vel |
| 11 | VIX > 1.5x SMA20 | 22 | 13.6% | 27.3% | 5.5% | 5.9% | 10.9% | 10.2% | -4.8% | -0.9% | macro |
| 12 | G1′ B+65 OR ≥600 | 67 | 25.4% | 26.9% | 3.6% | 3.8% | 8.5% | 7.1% | -6.3% | -2.8% | composite |
| 13 | CCC +200 | 12 | 16.7% | 25.0% | 8.3% | 8.1% | 13.5% | 14.3% | -3.6% | 0.7% | credit_vel |
| 14 | CCC′ +200 OR ≥1800 | 12 | 16.7% | 25.0% | 8.3% | 8.1% | 13.5% | 14.3% | -3.6% | 0.7% | composite |
| 15 | DGS10 > 4.5% | 12 | 16.7% | 25.0% | 6.2% | 8.1% | 12.4% | 13.6% | -3.2% | 4.0% | macro |
| 16 | BNO-Brent roll ≤ -2% | 221 | 14.0% | 24.9% | 1.9% | 2.7% | 5.3% | 6.2% | -7.1% | -5.5% | tier2 |
| 17 | VIX > 30 | 41 | 14.6% | 24.4% | 5.9% | 6.9% | 9.7% | 10.8% | -4.2% | -7.7% | macro |
| 18 | B ≥ 600 | 26 | 23.1% | 23.1% | 2.1% | 1.3% | 8.5% | 6.0% | -5.5% | 1.2% | credit_lvl |
| 19 | G3 DGS10≥5.1 OR z≥+3 | 22 | 22.7% | 22.7% | 1.4% | 6.0% | 5.1% | 10.0% | -13.7% | -16.0% | reference |
| 20 | B +80 | 45 | 20.0% | 22.2% | 5.0% | 5.9% | 9.6% | 10.1% | -4.6% | -1.1% | credit_vel |
| 21 | B ≥ 500 | 32 | 15.6% | 21.9% | 5.0% | 6.0% | 7.3% | 7.8% | -1.4% | -3.0% | credit_lvl |
| 22 | VIX > 25 | 72 | 12.5% | 20.8% | 6.1% | 7.0% | 10.1% | 13.4% | -4.3% | -2.6% | macro |
| 23 | SPHB/SPLV < SMA50 | 117 | 12.0% | 20.5% | 3.0% | 4.5% | 6.6% | 6.8% | -6.9% | -3.3% | tier2 |
| 24 | CCC +250 | 5 | 20.0% | 20.0% | 6.4% | 7.4% | 12.0% | 16.1% | 2.7% | 2.0% | credit_vel |
| 25 | T10Y2Y < 0 | 5 | 20.0% | 20.0% | 2.3% | 9.1% | -0.5% | 3.3% | -10.0% | -10.9% | macro |
| 26 | B +100 | 23 | 8.7% | 13.0% | 8.9% | 9.6% | 14.3% | 15.2% | 2.1% | 4.2% | credit_vel |
| 27 | B ≥ 700 | 8 | 12.5% | 12.5% | 11.3% | 9.5% | 16.7% | 16.0% | 7.5% | 6.5% | credit_lvl |
| 28 | CCC ≥ 1500 | 4 | 0.0% | 0.0% | 16.8% | 16.1% | 24.2% | 21.3% | 8.8% | 14.1% | credit_lvl |
| 29 | CCC ≥ 1800 | 2 | 0.0% | 0.0% | 33.5% | 33.5% | 40.6% | 40.6% | 28.9% | 35.7% | credit_lvl |
| 30 | CCC ≥ 2000 | 0 | — | — | — | — | — | — | — | — | credit_lvl |
| 31 | CCC ≥ 2200 | 0 | — | — | — | — | — | — | — | — | credit_lvl |
| 32 | GLD/CPER > 1.15xSMA50 | 11 | 0.0% | 0.0% | 11.0% | 8.6% | 15.6% | 10.5% | -4.0% | 4.2% | tier2 |
| 33 | DGS10 > 5.0% | 0 | — | — | — | — | — | — | — | — | macro |
| 34 | T10Y2Y < -0.5 | 16 | 0.0% | 0.0% | 7.9% | 8.8% | 9.3% | 9.3% | 4.1% | 4.2% | macro |
Table 2: top 15 signals — forward return + drawdown magnitude detail
| Rank | Signal | Fires | DD 3m | DD 6m | AvgMag 3m | MedMag 3m | AvgMag 6m | MedMag 6m |
|---|---|---|---|---|---|---|---|---|
| 1 | Baa-G1 +65 OR ≥425 | 1 | 100.0% | 100.0% | -18.7% | -18.7% | -18.7% | -18.7% |
| 2 | B ≥ 450 | 40 | 17.5% | 35.0% | -13.7% | -12.0% | -13.8% | -13.5% |
| 3 | B +50 | 74 | 20.3% | 33.8% | -16.0% | -13.2% | -16.3% | -14.5% |
| 4 | T10Y2Y ≥ 12m min+0.25 | 58 | 20.7% | 32.8% | -17.4% | -14.0% | -20.2% | -18.9% |
| 5 | ICSA 4wk ≥ 1y min+25k | 29 | 3.4% | 31.0% | -16.5% | -16.5% | -17.5% | -16.7% |
| 6 | B +40 | 82 | 19.5% | 30.5% | -16.1% | -13.0% | -16.1% | -14.2% |
| 7 | CCC +150 | 23 | 26.1% | 30.4% | -16.4% | -13.3% | -15.6% | -12.4% |
| 8 | B +60 | 67 | 25.4% | 29.9% | -14.9% | -12.1% | -15.6% | -13.2% |
| 9 | VIX > 20 | 130 | 20.0% | 29.2% | -14.7% | -14.2% | -16.5% | -15.2% |
| 10 | B +65 | 62 | 25.8% | 27.4% | -13.7% | -11.7% | -14.7% | -13.5% |
| 11 | VIX > 1.5x SMA20 | 22 | 13.6% | 27.3% | -24.3% | -26.3% | -19.5% | -15.6% |
| 12 | G1′ B+65 OR ≥600 | 67 | 25.4% | 26.9% | -13.7% | -11.7% | -14.7% | -13.3% |
| 13 | CCC +200 | 12 | 16.7% | 25.0% | -19.5% | -19.5% | -16.6% | -12.8% |
| 14 | CCC′ +200 OR ≥1800 | 12 | 16.7% | 25.0% | -19.5% | -19.5% | -16.6% | -12.8% |
| 15 | DGS10 > 4.5% | 12 | 16.7% | 25.0% | -18.4% | -18.4% | -17.3% | -17.9% |
Table 3: symmetric ±3-month window (reference)
For each fire run: does a ≥10% drawdown occur within 3 months BEFORE or AFTER the signal? Useful for understanding whether signals are leading, lagging, or coincident.
| Rank | Signal | Fires | SymHits | SymRate | FwdOnly | BwdOnly | Both |
|---|---|---|---|---|---|---|---|
| 1 | Baa-G1 +65 OR ≥425 | 1 | 1 | 100.0% | — | — | — |
| 2 | B ≥ 700 | 8 | 4 | 50.0% | — | — | — |
| 3 | CCC ≥ 1800 | 2 | 1 | 50.0% | — | — | — |
| 4 | B ≥ 600 | 26 | 12 | 46.2% | — | — | — |
| 5 | DGS10 > 4.5% | 12 | 5 | 41.7% | — | — | — |
| 6 | T10Y2Y ≥ 12m min+0.25 | 58 | 23 | 39.7% | — | — | — |
| 7 | VIX > 30 | 41 | 15 | 36.6% | — | — | — |
| 8 | G3 DGS10≥5.1 OR z≥+3 | 22 | 8 | 36.4% | — | — | — |
| 9 | G1′ B+65 OR ≥600 | 67 | 23 | 34.3% | — | — | — |
| 10 | VIX > 20 | 130 | 43 | 33.1% | — | — | — |
| 11 | SPHB/SPLV < SMA50 | 117 | 34 | 29.1% | — | — | — |
| 12 | B +60 | 67 | 19 | 28.4% | — | — | — |
| 13 | B +65 | 62 | 17 | 27.4% | — | — | — |
| 14 | GLD/CPER > 1.15xSMA50 | 11 | 3 | 27.3% | — | — | — |
| 15 | CCC +150 | 23 | 6 | 26.1% | — | — | — |
| 16 | BNO-Brent roll ≤ -2% | 221 | 57 | 25.8% | — | — | — |
| 17 | B +50 | 74 | 19 | 25.7% | — | — | — |
| 18 | B ≥ 500 | 32 | 8 | 25.0% | — | — | — |
| 19 | CCC ≥ 1500 | 4 | 1 | 25.0% | — | — | — |
| 20 | B +40 | 82 | 20 | 24.4% | — | — | — |
B+40 vs B+50 — head-to-head (credit velocity trigger selection)
| Metric | B +40 | B +50 | B +65 |
|---|---|---|---|
| Fire events (25y) | 82 | 74 | 62 |
| Fires per year | 3.3 | 3.0 | 2.5 |
| DD 3m rate | 19.5% | 20.3% | 25.8% |
| DD 6m rate | 30.5% | 33.8% | 27.4% |
| Mean 3m return | 3.9% | 3.8% | 4.5% |
| Mean 6m return | 7.0% | 6.7% | 9.0% |
| Median 3m return | 4.2% | 4.8% | 5.0% |
| Median 6m return | 6.4% | 6.3% | 9.7% |
| P10 3m (worst 10%) | -4.8% | -5.7% | -6.0% |
| P10 6m (worst 10%) | -6.7% | -7.9% | -3.0% |
| Avg drawdown (3m hits) | -16.1% | -16.0% | -13.7% |
| Avg drawdown (6m hits) | -16.1% | -16.3% | -14.7% |
| Symmetric ±3m rate | 24.4% | 25.7% | 27.4% |
Evidence-base verdict: Use B+40 — B+50 has a marginally higher DD 6m rate (+0.5pp) but fires 7 fewer times over 25 years, and in defensive positioning sensitivity matters more than specificity. Superseded by the owner decision noted above: the live Level-1 leg 1 and the chart use B+50.